Karnataka Real Estate Market Reports
Quarterly market insights, price trends, and investment analysis for Bangalore, Mysore, Hubli & across Karnataka — backed by 20+ years of on-ground realty experience.
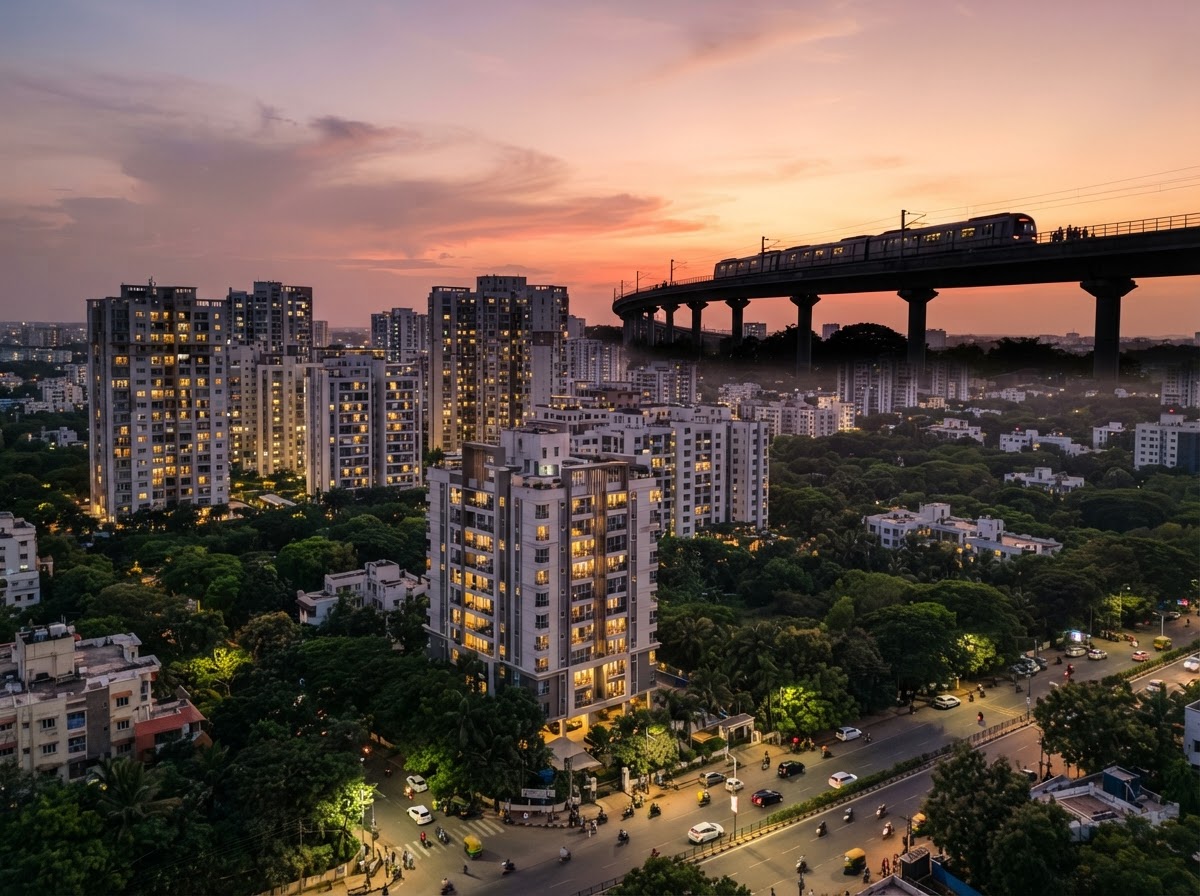
Bangalore & Karnataka Real Estate Market Report — Q2 2026
Jul 2026
Key Highlights
- 1North Bangalore plots appreciated 18% YoY — highest in Karnataka
- 2Yelahanka BDA layouts see 22% price jump since Q4 2025
- 3Mysore Gokulam demand up 35% from Bangalore-based buyers
- 4Hubli DTCP layouts see 10% growth — smart city investments paying off
- 5Average property registration time reduced to 12 days
Average Price per Sq.Ft by City
Q2 2026 — ₹/sq.ft
Year-on-Year Growth by City
Q2 2026 — % appreciation
2,340 units sold this quarter
1,890 units sold this quarter
680 units sold this quarter
420 units sold this quarter
310 units sold this quarter
| City / Area | Avg Price/sq.ft | YoY Growth | Sales Volume |
|---|---|---|---|
| Bangalore (North) | 6,500 | +18% | 2,340 units |
| Bangalore (South) | 8,200 | +12% | 1,890 units |
| Mysore | 4,500 | +12% | 680 units |
| Hubli | 3,200 | +10% | 420 units |
| Mangalore | 5,200 | +8% | 310 units |
Where Smart Money is Going in Karnataka
Based on 20+ years of realty experience and current market data.
18% YoY growth driven by airport proximity and metro extension. Yelahanka BDA layouts are the top pick.
Explore North BangaloreBest entry-level pricing near the airport. Aerospace SEZ driving employment and demand. 15% quarterly appreciation.
Explore Devanahalli35% demand increase from Bangalore expats. MUDA-approved plots at 40% lower cost than Bangalore equivalents.
Explore MysoreReady to Sell or Buy a Property?
Let Srimanth Properties help you achieve the best deal — zero commission, complete transparency.